
2020 End of year Pedestrian Counter Analysis
By Dakota Griffith, Economic Development Research Assistant
Updated: February 17, 2021, 12:00pm
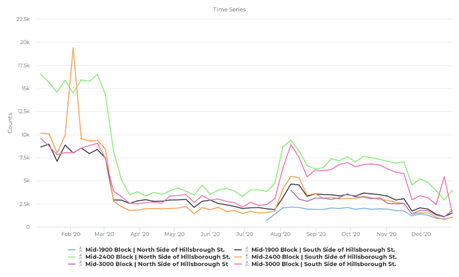
2020 Weekly time-series graph
2020 was a year unlike any other, and the pedestrian traffic on Hillsborough St. was no exception. Beginning in March, COVID-19 had significant impacts on the pedestrian counts throughout the rest of the year.
The counter located on the north side of the 2400 block went from having 16K pedestrians per week in late February to just 3.5K per week in March. This dropoff was consistent throughout the district, as each counter saw similar drops in traffic. Pedestrian traffic levels were consistent from the start of the pandemic until August, when classes began again at NC State. Throughout August, traffic recovered to about half of pre-COVID counts; however, traffic had fallen slightly again after all NCSU classes moved to online only. Pedestrian counts then remained consistent again throughout the rest of the semester. Unsurprisingly, December saw similar pedestrian counts to the pandemic summer months.
Evaluating the Impact of Pandemic throughout the Year
The combined counts of the 2400 block pedestrian counters will be used as a comparison between 2019 and 2020 because these were the only pedestrian counters active throughout the entirety of both years. The 2400 block also has the most pedestrian traffic on the street. Pedestrian traffic fluctuates throughout the year because of the semester schedules at NCSU.
Due to these fluctuations, it would be useful to section off the data to compare similar periods. The groupings will be from January to March, March to May, May through August, and August through mid-November. By comparing 2019 and 2020 in these specific groups, we will better understand how pedestrian traffic changed due to the pandemic.
The first group from January to March will allow comparisons before the start of the pandemic. The second group from March to May will compare counts after the pandemic but before the end of the Spring semester. The third group, from May to August, focuses on Summer months between semesters. The fourth group from August through mid-November will compare counts during the fall semester.
Pedestrian traffic in 2020 started strong, as average weekly traffic from January to March was up 24% compared to the same time frame in 2019. The start of the COVID-19 pandemic quickly ended this strong start, as average weekly traffic from March to May suffered a 70% reduction compared to the same time in 2019. The pandemic's impact was slightly less throughout the summer months as 2020 pedestrian counts were 53% lower than 2019. During the fall semester, 2020 saw a 61% reduction in pedestrian traffic compared to 2019.
While academic semesters were in session, the pandemic reduced pedestrian traffic to about a third of the total during the same time in 2019. The impact of the pandemic on traffic during the summer months, when classes were not in session, was less but still incredibly significant. Traffic during this period was half the total compared to the summer of 2019. Overall, the pandemic's impact on pedestrian traffic was massive and will continue until the situation returns to normal.
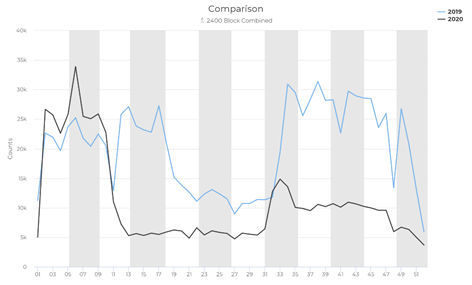
Weekly time-series graph comparing 2019 & 2020 pedestrian counts.