
Hillsborough Street Pedestrian Counters: A Year in Review
By Dakota Griffith, Economic Development Research Assistant
Updated: February 7, 2020, 12:00pm
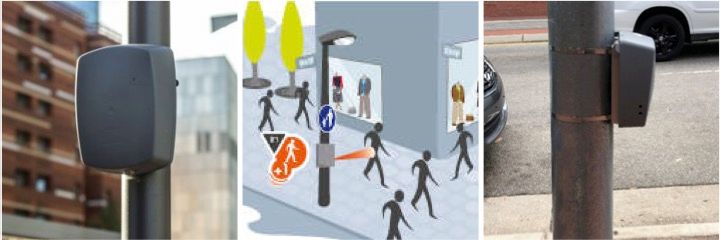
PYRO Box pedestrian counter.
Last year Live It Up! Hillsborough Street (HSCSC) installed four pedestrian counters along the street. The first two counters located on the north and southside of the 2400 block have now been active for a full year. A full year's worth of data allows for the evaluation of pedestrian traffic flow on the street during different conditions. The other two counters have been active since June 2019 and as of this post are located on the northside of the 1900 block and south side of the 3000 block of Hillsborough Street- the aim being to build a complete profile of foot traffic along the street.
Some preliminary findings include that the northside of the 2400 block had an average daily traffic over the past year of 2,300 (±366.4) pedestrians compared to 1,290 (±144.5) pedestrians across the street on the southside of the block. During the summer months traffic decreases on the southside by just over 50%. Clearly traffic on the side of the street closer to the school is more influenced by school being out of semester. Another interesting find is that 80% of foot traffic throughout the day happens in the hours been 11AM and 9PM, peaking at 12PM. The size of the “dinner rush” is only 59% of the size of the “lunch rush”.

Daily time series graph of observed pedestrian counts from the southside of the 2400 block of Hillsborough Street (2018-19).
In addition to analyzing the data we have also conducted tests on all four counters to verify the accuracy of the data they are collecting. Each counter was given two hours where a human tallied each person walking by in 15 minute intervals and compared that tally to the counter data collected during those same 15 minutes. The tests showed that the average percent error of the data is +36.6%. Meaning multiplying the recorded count by 1.366 will give a more accurate representation of traffic volume (the numbers earlier were multiplied by this correction factor). At 95% confidence the observed percent error is between 21.3% and 51.9%. More tests are currently being run to get a more accurate depiction of the error in the data.
Further questions to investigate include:
- Impact of the weather
- Further investigation on accuracy
- Creation of a model that predicts traffic under certain conditions
- More Year to Year analysis
- Using the data for event impact analysis